Consult
Consultation with our experts prior to the design process saves time and money.
Design
Exo Dek team members are skilled to assist in the design process at all stages.
Design Tools
Our decking calculator is a valuable tool to be used to estimate needed board feet of your design.
Hardwood Decking Wood Comparison Charts
Stiffness Chart
Modulus of Elasticity (MOE) Ratings for Various Species of Wood (1000 psi or Kspi)
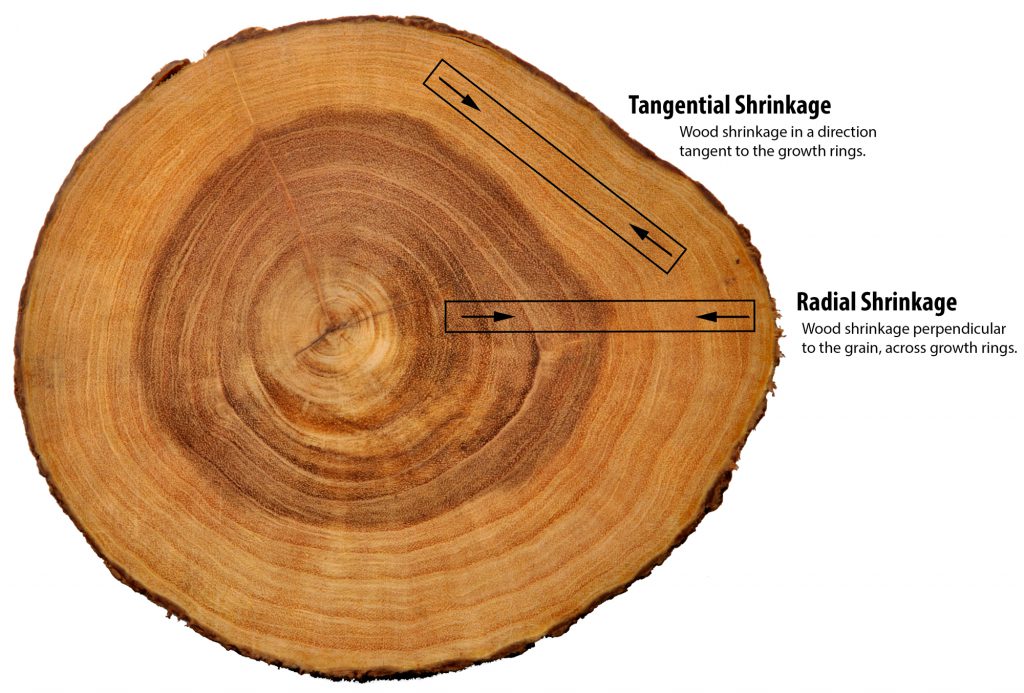
Modulus of elasticity ratings are derived from the stiffness or resistance to bending of the particular wood species. These ratings pertain to longitudinal modulus of elasticity, not tangential or radial ratings.(1)
(1) The Wood Handbook – Wood as an engineering material, USDA, General Technical Report 113.
Strength Chart
Modulus of Rupture (MOR) Ratings for Various Species of Wood (1000 psi or Kspi)
The modulus of rupture is a measure of the maximum load carrying capacity of a given species in bending strength and is proportional to the breaking point or maximum strength as borne by the specimen.(1)
(1) The Wood Handbook – Wood as an engineering material, USDA, General Technical Report 113.
Density Chart
Density Ratings for Various Species of Wood (KG/ Cubic Meter)
A wood product’s weight is determined by combining the density of the basic wood structure with the material’s moisture content. The density of wood, exclusive of water, varies a great deal within and between species. Density variations within a particular species of approximately 10% should be considered normal. A wood’s weight is always partially contingent on its moisture content, so moisture should always be taken into consideration. The figures left represent the density at approximately 12% moisture content.(1)
(1) The Wood Handbook – Wood as an engineering material, USDA, General Technical Report 113.
Hardness Chart
Janka Hardness Ratings for Various Wood Species
The industry standard method for determining the hardness of wood products is called the Janka hardness test. Janka hardness of a given wood species is defined by a resistance to indentation test as measured by the load (pounds of pressure) required to embed a 11.28mm or 0.444″ diameter ball to one-half its diameter into the wood. The Janka values presented are the average of penetrations on both flat grain or plain sawn and vertical grain or quartersawn boards.
(1) The Wood Handbook – Wood as an engineering material, USDA, General Technical Report 113.